OEE (Overall Equipment Effectiveness)

What Is OEE?
OEE (Overall Equipment Effectiveness) is a “best practices” metric that identifies the percentage of planned production time that is truly productive. An OEE score of 100% represents perfect production: manufacturing only good parts, as fast as possible, with no downtime.
OEE is useful as both a benchmark and a baseline:
- As a benchmark, OEE can be used to compare the performance of a given production asset to industry standards, to similar in-house assets, or to results for different shifts working on the same asset.
- As a baseline, OEE can be used to track progress over time in eliminating waste from a given production asset.
OEE Benchmarks
So, as a benchmark, what is considered a “good” OEE score? What is a world-class OEE score?
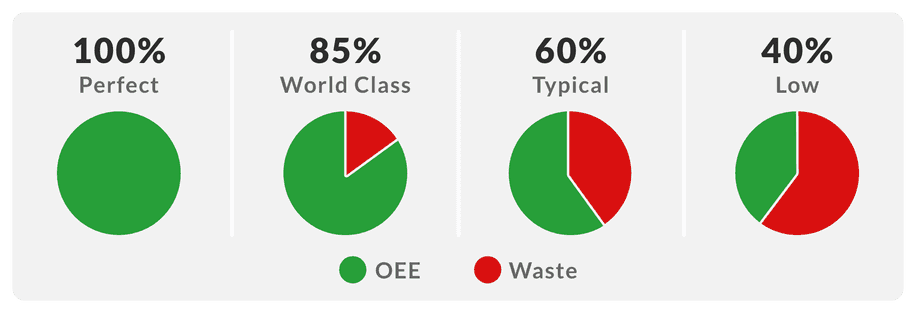
- 100% OEE is perfect production: manufacturing only good parts, as fast as possible, with no stop time.
- 85% OEE is considered world class for discrete manufacturers. For many companies, it is a suitable long-term goal.
- 60% OEE is fairly typical for discrete manufacturers, but indicates there is substantial room for improvement.
- 40% OEE is not at all uncommon for manufacturing companies that are just starting to track and improve their manufacturing performance. It is a low score and in most cases can be easily improved through straightforward measures (e.g., by tracking stop time reasons and addressing the largest sources of downtime – one at a time).

Simple OEE Calculations
So how is the OEE score calculated?
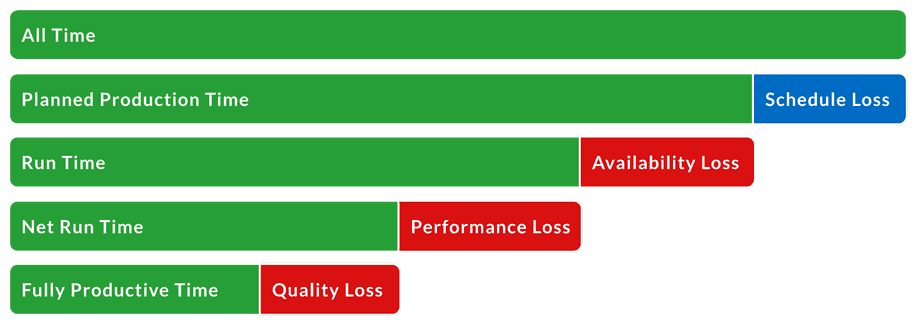
In simplest terms, OEE is the ratio of Fully Productive Time to Planned Production Time. In practice, OEE is calculated as:
OEE = (Good Count × Ideal Cycle Time) / Planned Production Time
Let’s define some terms used in the OEE Formula:
- Good Count: pieces that are manufactured without any defects
- Ideal Cycle Time: the theoretical fastest possible time to manufacture one piece
- Planned Production Time: the total time that the production asset is scheduled for production
- Fully Productive Time: producing only good pieces, as fast as possible, with no stop time
Preferred OEE Calculation
The preferred way to calculate OEE is mathematically equivalent to the simple formula described above but provides a much richer understanding of waste in the manufacturing process by breaking it down into three factors:
- Availability Loss
- Performance Loss
- Quality Loss

Availability Calculation
Availability takes into account Availability Loss, which includes all events that stop planned production for an appreciable length of time (typically several minutes or longer). Availability Loss includes Unplanned Stops (such as equipment failures and material shortages), and Planned Stops (such as changeover time).
Availability is calculated as the ratio of Run Time to Planned Production Time, where Run Time is simply Planned Production Time less Stop Time:
Availability = Run Time / Planned Production Time
Where Run Time = Planned Production Time − Stop Time
Performance Calculation
Performance takes into account Performance Loss, which includes all factors that cause the production asset to operate at less than the maximum possible speed when running (including Slow Cycles and Small Stops).
Performance is calculated as the ratio of Net Run Time to Run Time. In practice, it is calculated as:
Performance = (Ideal Cycle Time × Total Count) / Run Time
Ideal Cycle Time is the theoretical fastest possible time to manufacture one piece. Therefore, when it is multiplied by Total Count the result is Net Run Time – the theoretical fastest possible time to manufacture the total quantity of pieces.
Here is a simple example of a Performance calculation:
| Item | Value | Explanation |
|---|---|---|
| Ideal Cycle Time | 1 minute | Theoretical fastest time to produce this part. |
| Total Count | 300 | Total quantity of pieces manufactured during this shift. |
| Run Time | 330 minutes | Run time of this shift (planned production time less stop time). |
| Performance | 90.9% | (Ideal Cycle Time × Total Count) / Run Time = (1 × 300) / 330 |
Quality Calculation
Quality takes into account Quality Loss, which factors out manufactured pieces that do not meet quality standards, including pieces that are later reworked.
Quality is calculated as the ratio of Fully Productive Time (only Good Count manufactured as fast as possible with no Stop Time) to Net Run Time (fastest possible time for Total Count). In practice, it is calculated as:
Quality = Good Count / Total Count
OEE Calculation
OEE takes into account all losses (Stop Time Loss, Speed Loss, and Quality Loss), resulting in a measure of truly productive manufacturing time.
OEE is calculated as the ratio of Fully Productive Time to Planned Production Time. In practice, it is calculated as:
OEE = Availability × Performance × Quality
If the equations for Availability, Performance, and Quality are substituted in the above equation and then reduced to their simplest terms the result is:
OEE = (Good Count × Ideal Cycle Time) / Planned Production Time
This is the “simplest” OEE calculation described earlier. With a bit of reflection, it can be seen that multiplying Good Count by Ideal Cycle Time results in Fully Productive Time (manufacturing only good parts, as fast as possible, with no stop time).
Perfect Production
Earlier, an OEE score of 100% was described as perfect production: manufacturing only good parts, as fast as possible, with no stop time. Let’s tie this notion of perfect production to the OEE calculation:
- Manufacturing only good parts means a Quality score of 100%
- As fast as possible means a Performance score of 100%
- With no stop time means an Availability score of 100%
Working through real-world examples is a great way to master the OEE calculation. For free worked examples, templates, spreadsheets, and other resources visit: https://www.oee.com/.
Plant Floor Metrics
OEE is a great tool for managers, but for plant floor employees it can be a bit abstract. Plant floor employees will perform best when they are given goals that are real-time, easily interpreted and highly motivational. A good example of an effective set of plant floor metrics is TAED:
- Target: a real-time production target driven by the planned rate of production
- Actual: the actual production count
- Efficiency: the ratio of Target to Actual; how far ahead or behind production is running in terms of a percentage
- Downtime: accumulated unplanned stop time for the shift updated in real-time; this keeps a strong focus on a key actionable improvement area
WHAT YOU SHOULD DO NEXT...
1. Learn more about how our product, Vorne XL, can help you eliminate waste and significantly improve OEE.
Vorne XL is the simplest and fastest way to monitor and improve production. It's a one-time cost and takes just a day to install. And you can try it completely free for 90 days.
Learn More2. Download our FREE package of tools to supercharge your manufacturing productivity
The package includes leadership lessons, training guides, meeting and report templates, summaries of key concepts, project organizers, and more. You'll also receive our monthly newsletter for free. Unsubscribe at any time.
DOWNLOAD FREE LEAN TOOLS3. Sign up for our monthly newsletter
Get free monthly updates with proven methods for improving our manufacturing productivity. Unsubscribe at any time.

